Software.com
Comparisons
Any group, any metric, side by side. Investment decisions backed by data instead of gut calls.

The Comparisons detail view: an event-based comparison tracking productivity before and after a significant organizational change, with the metric selector allowing teams to pivot across productivity, cost efficiency, velocity, and quality.
Context
Engineering leaders at Software.com's customers were constantly making comparative decisions without comparative data. Is our offshore team as productive as our onshore one? Is AI tool A worth more than AI tool B? Are contractors delivering at the same quality as FTEs? These questions weren't abstract. They drove real budget and headcount decisions. But they were almost always answered by intuition because the data to answer them objectively didn't exist in a form that was easy to use.
The Problem
Most analytics tools are built around fixed comparison structures: this period versus last period, this team versus the company average. But the questions engineering leaders were actually asking didn't fit that template. Comparing three geolocations, two vendors, and last year's baseline all at once wasn't a fringe case; it was how real allocation decisions worked.
The design challenge was building a comparison experience flexible enough to handle any combination of groups while remaining legible. Flexibility and clarity usually trade off against each other: the more configurable a view is, the harder it is to read at a glance. The goal was to avoid that tradeoff.
The Approach
The key design decision was treating groups as ad hoc selections rather than pre-defined views. Rather than building separate “team vs. team” or “tool vs. tool” interfaces, we built a single flexible comparison engine where any entities could be added and benchmarked across the same metric set. Users weren't locked into a comparison structure the product had anticipated. They could compare whatever combination of groups was relevant to the decision they were actually trying to make.
The Solution
The Index
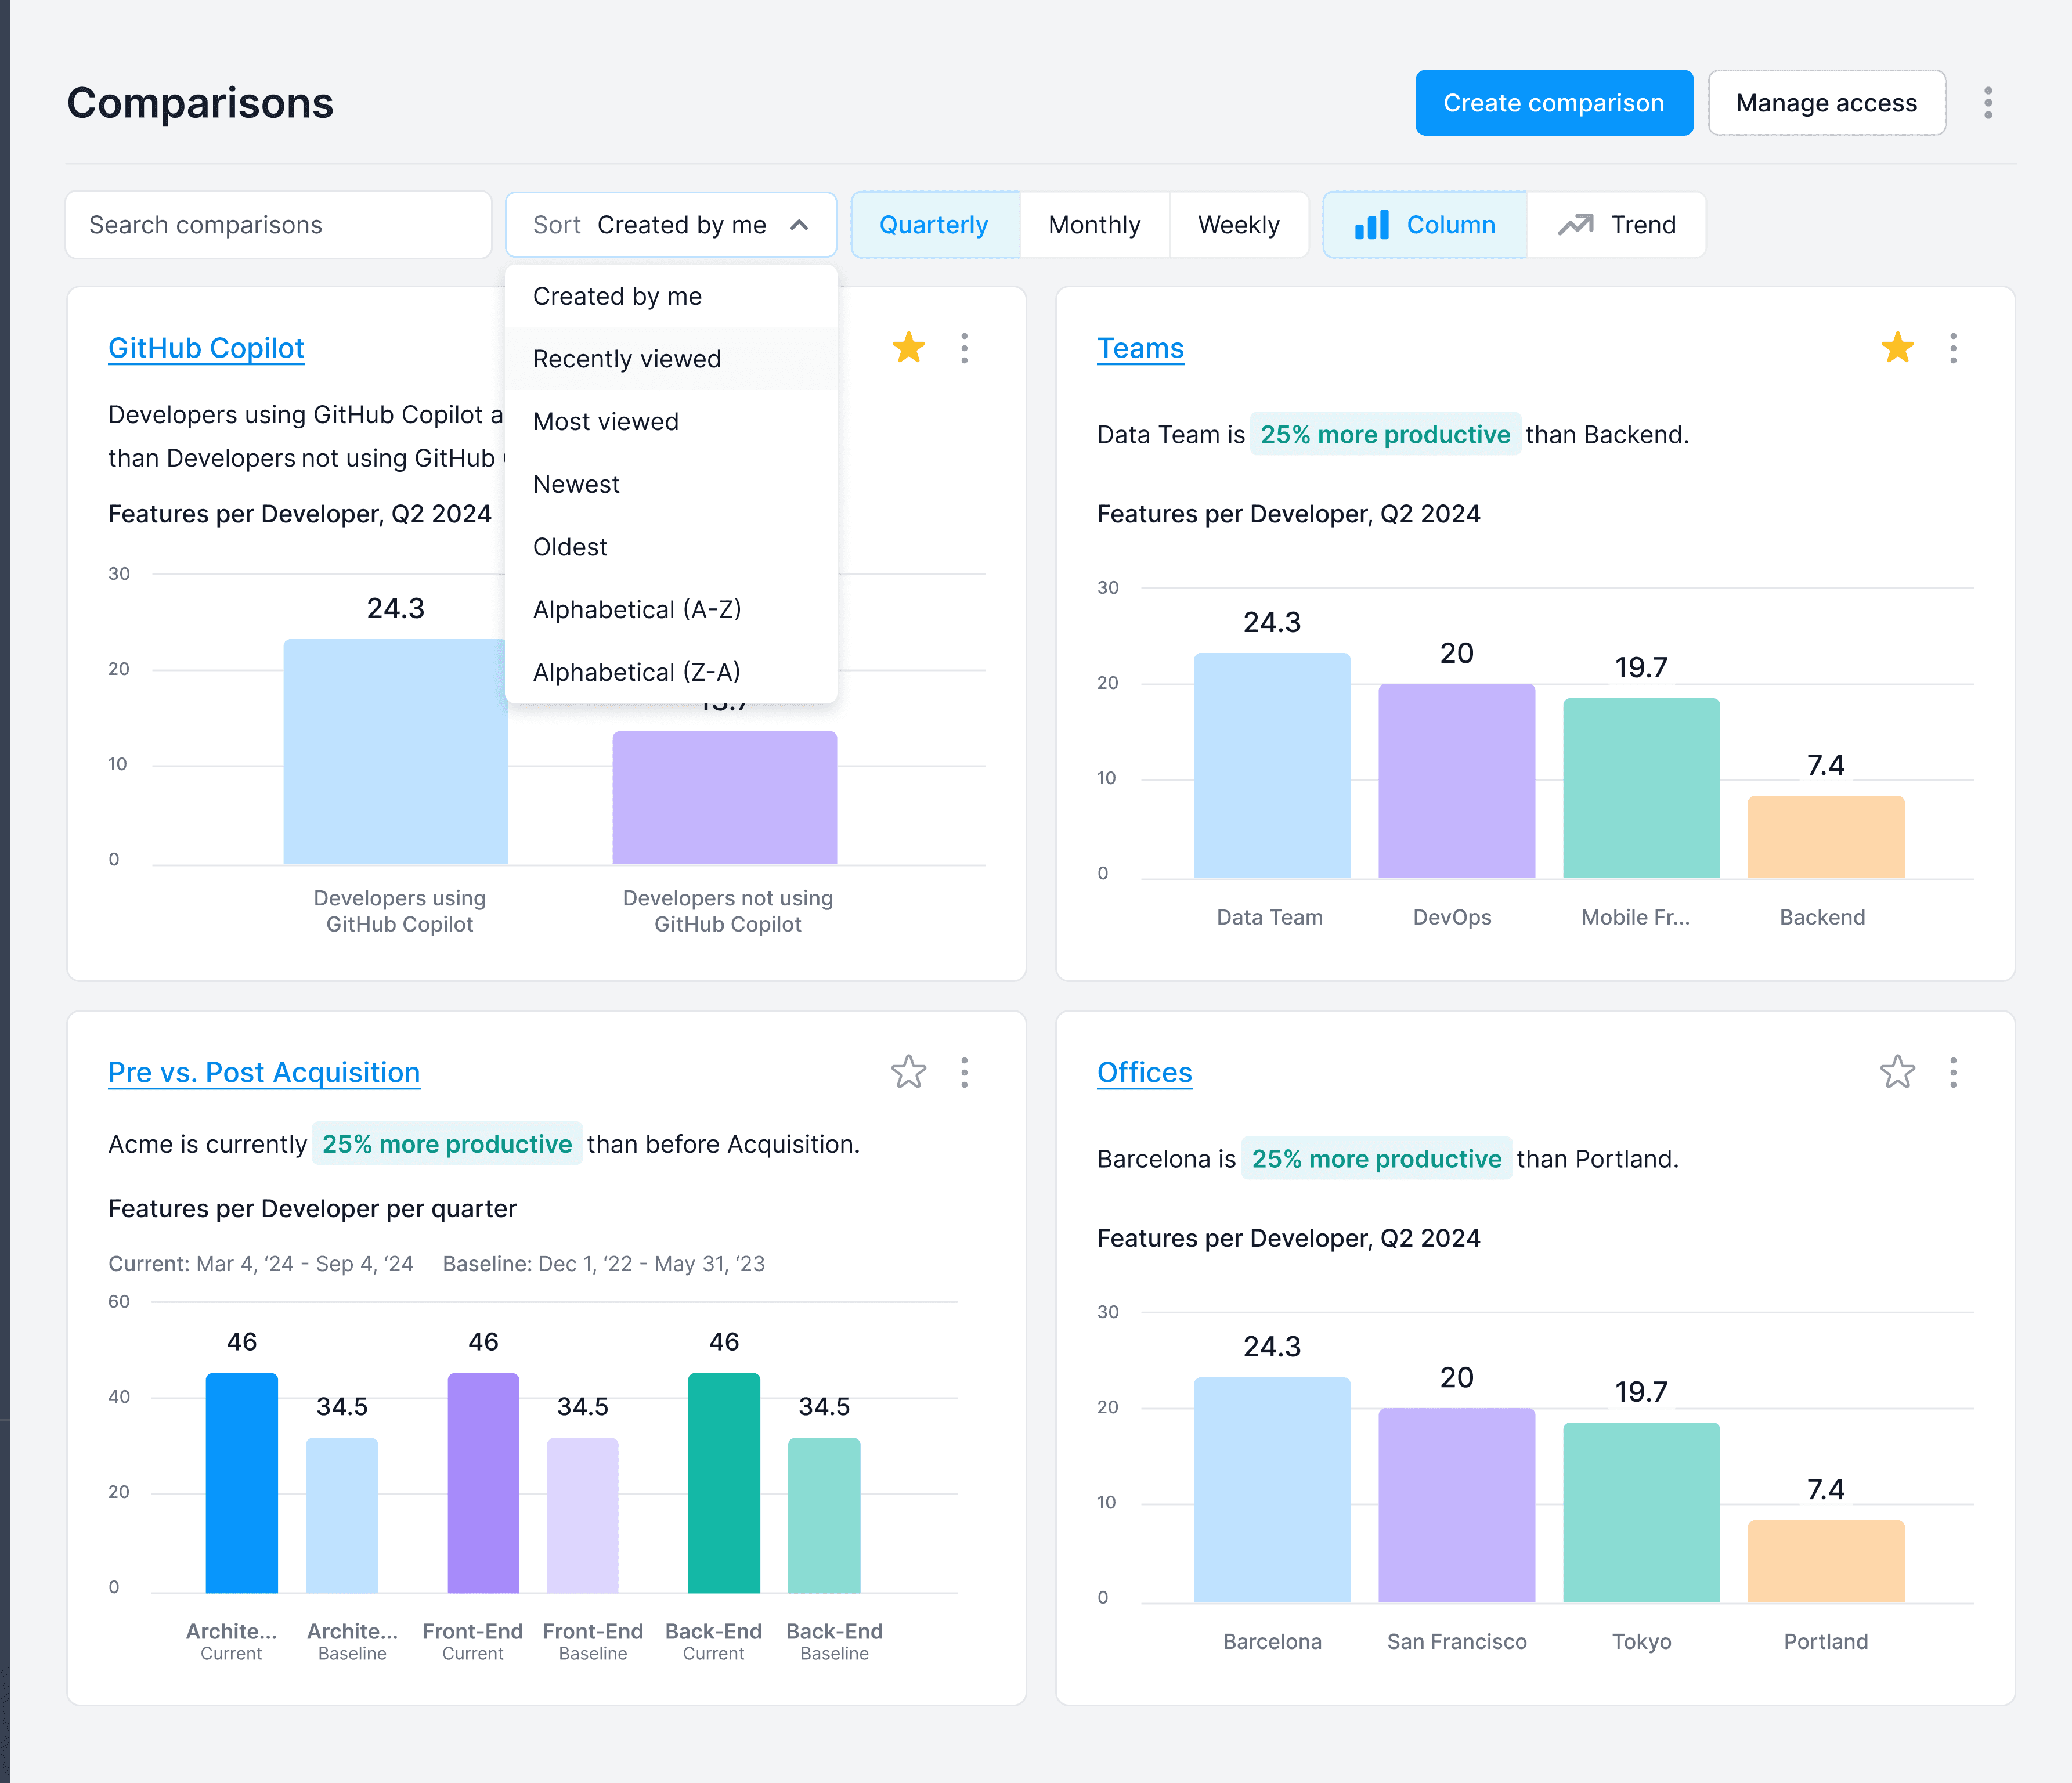
The index gave leaders a bird's-eye view of every comparison they'd built. Each row summarized a distinct comparison: its name, the groups involved, and the difference in Features per Developer across those groups, Software.com's primary productivity KPI. From here, leaders could manage their library of comparisons and jump directly into any one of them to investigate further.
The Detail View
Each comparison opened into a full detail view with a metric selector at the top (productivity, cost efficiency, velocity, or quality), letting leaders pivot the comparison to whatever question was most relevant. The detail view supported two distinct types of comparisons: standard comparisons that benchmarked selected groups against one another, and event-based comparisons that measured the same group's performance before and after a significant event: an acquisition, a process change, a new tool rollout. The example shown is event-based, tracking how a team's productivity shifted following a major organizational change and making it possible to quantify the impact of decisions that would otherwise be impossible to measure.
The Outcome
Comparisons gave engineering leaders a way to bring data into conversations that had previously been dominated by opinion. Whether benchmarking AI tool spend, evaluating vendor performance, or making the case for headcount reallocation, the tool made the argument from numbers rather than anecdote. The flexibility to compare any combination of groups meant it fit the actual shape of the decisions leaders were making, not just the ones the product had anticipated.